AWS Bedrock Model Invocation Logging - an Overview

AWS Bedrock model invocation logging is a useful component of an evaluation-in-depth strategy that provides generative AI developers with important signals about how their applications and selected models perform. For account administrators, it helps detect potentially uncontrolled access to models, as on-demand inference calls are also logged. There's a bit of nuance that everyone should know before hitting the toggle, clicking some options, and walking away, however!
What is AWS Bedrock Model Invocation Logging?
Model invocation logging is an account-wide setting that enables logging of all LLM requests made to all provisioned models that are hosted on AWS Bedrock. This includes requests made from the CLI/SDK as well as the Playground.
Let's see how this works from the console. I'll talk to CLI and SDK access as well where applicable .
This setting can be found in the Bedrock console under Bedrock configurations > Settings:
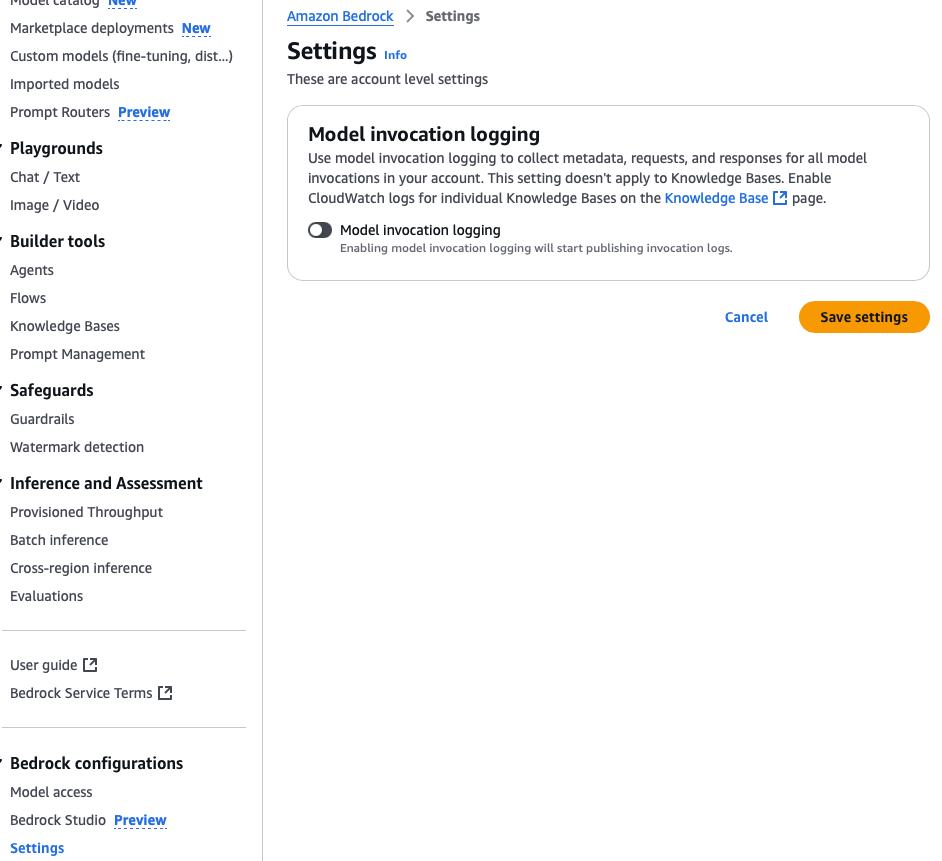
When the toggle is activated, a number of additional configuration options will appear. There are multiple log destinations to select, and each option requires you to have already configured the destination.
Option: S3 Only

For this example, the bedrock-invocation-logging-insights bucket has already been created with appropriate access permissions. Again, this must be done prior to activating model invocation logging.
Option: CloudWatch Log Group
For CloudWatch Logs, the Log group must be specified as well, but the UI is a little different (and important information is called out that is not presented in the S3 configuration):
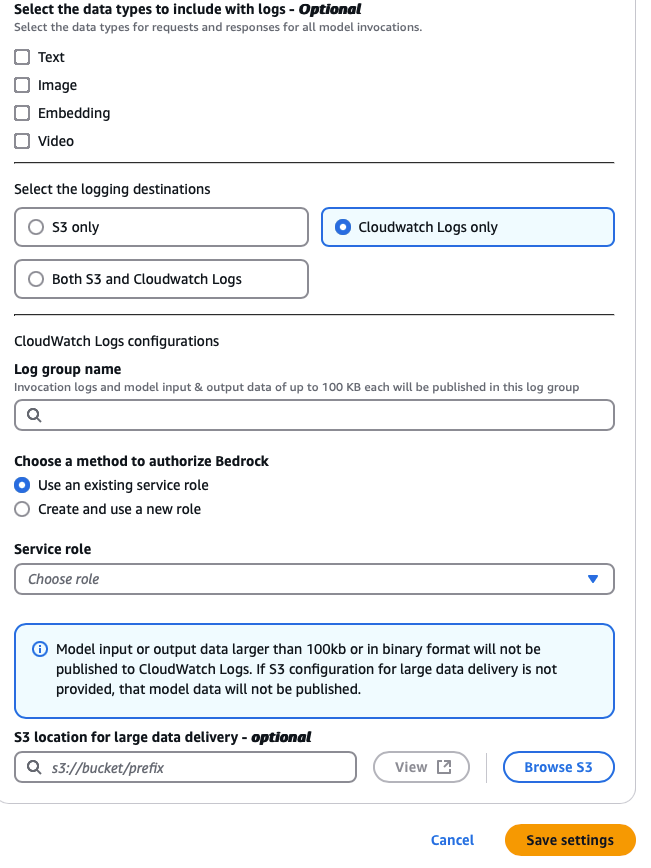
Here the Log group name can be hand-entered. I did not have any luck getting the search UI to come up when clicking the magnifying glass icon, or autocomplete when entering the name of a known log group, but this log group must also be set up prior, otherwise errors will be returned to the console ("The specified log group does not exist").
For this exercise, when selecting Create and use a new role, the following policy is generated:
{
    "Version": "2012-10-17",
    "Statement": [
        {
            "Sid": "AmazonBedrockModelInvocationCWDeliveryRole",
            "Effect": "Allow",
            "Action": [
                "logs:CreateLogStream",
                "logs:PutLogEvents"
            ],
            "Resource": "arn:aws:logs:us-east-1:111111111111:log-group:elliot/model-invocation-logs:log-stream:aws/bedrock/modelinvocations"
        }
    ]
}
and the associated trust relationship policy:
{
  "Version": "2012-10-17",
  "Statement": [
    {
      "Effect": "Allow",
      "Principal": {
        "Service": "bedrock.amazonaws.com"
      },
      "Action": "sts:AssumeRole",
      "Condition": {
        "StringEquals": {
          "aws:SourceAccount": "111111111111"
        },
        "ArnLike": {
          "aws:SourceArn": "arn:aws:bedrock:us-east-1:111111111111:*"
        }
      }
    }
  ]
}
Look back at the permissions policy, notice how the path to the a log group and stream is also accounted for in the policy? That is not a valid log group and stream in this configuration! When selecting "Save settings" and an invalid log group is specified under Log group name, the role is created anyway and not cleaned up after the failure, so another reason to have the name of the group at hand is to avoid creating roles that need cleanup after the fact. It would be nice to have this wrapped in a transaction that also cleans up the associated role resource.
Returning back to the callout:
Model input or output data larger than 100kb or in binary format will not be published to CloudWatch Logs. If S3 configuration for large data delivery is not provided, that model data will not be published.
This is an important consideration to understand based on use case.
The 4 checkboxes at the top of the form prompt for what data types to record: text, image, embedding and video. When toggled on, those outputs will be stored in the target bucket and log group. For images and video, these will almost always exceed the 100kb threshold. Text outputs may also exceed this threshold, depending on the length of the prompt and response, because both the prompt and response as well as other output related to the request are stored.
Option: Both S3 and CloudWatch Logs
Choosing Both S3 and CloudWatch logs effectively combines the two forms into a single form that still work the same way, except both destinations are used. The optional large data delivery portion may be redundant depending on requirements.
So what does that look like in practice? Here's an example of the data/ directory in S3 for a recorded invocation to Nova Canvas. There are two assets:
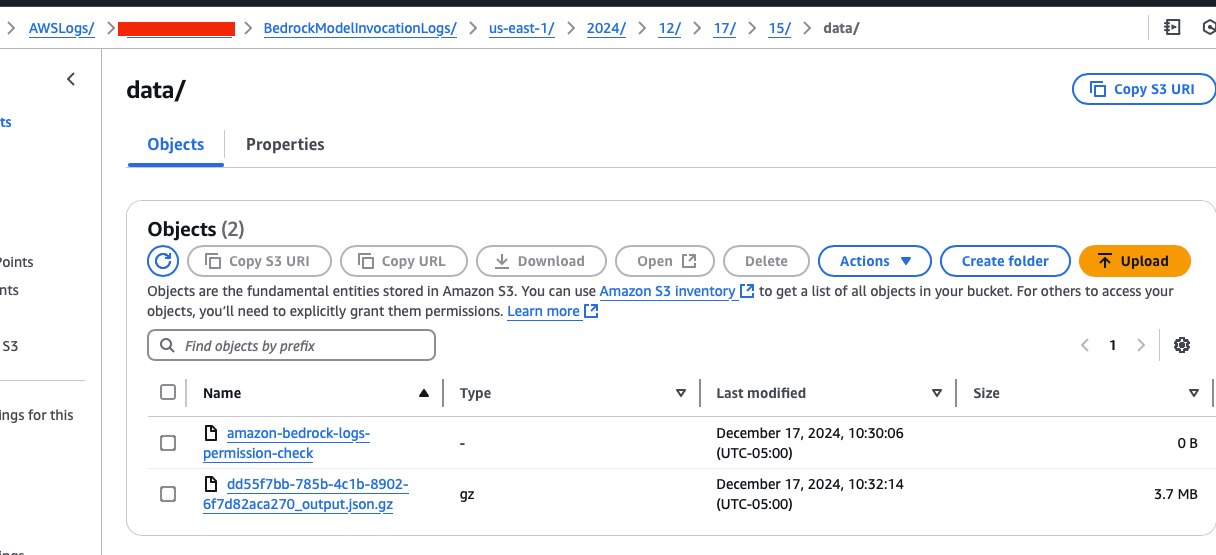
The size of the gz file indicates there's some binary data, and in fact the 3 images that were generated from the Canvas prompt are saved in base-64 format in a JSON array labeled "images".
(Note: as of 1/24/25 I am working on identifying the purpose of the permission-check log files. These are all zero-byte files, and are not generated in every directory. If you know, please share! I'll update this when I learn more)
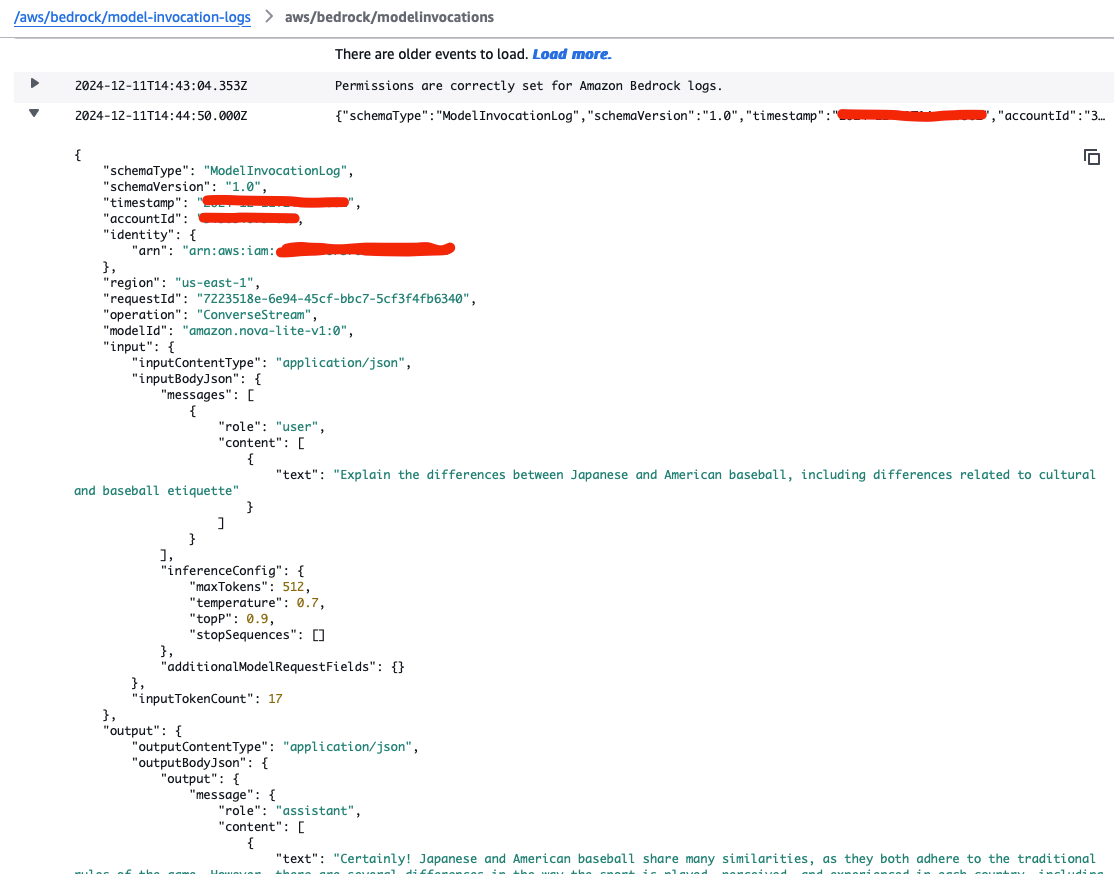
Text logs record almost identical data that would be recorded in CloudWatch's log group. The caller identity (ARN), region, API operation, model id, input prompt text, inference configuration, output text, total token count and more are available to be reviewed. It's worth mentioning that much of the same information can be collected in the base response for InvokeModel and Converse API calls.
This is all critical data that serves as leading indicators of the performance of a generative AI application, relative to the task being performed.
It does come at a cost, like most associated generative AI resources do in Bedrock:
- Total cost per request may increase based on S3 storage and lifecycle requirements
- The control plane broadens to include tools that can query over this data, such as S3 Select, Athena, and QuickSight visualizations (along with the associated concerns around access), and this should be well understood prior to enabling model invocation logging so the dependent destinations are setup correctly
- Similar information is available in the InvokeModel and Converse API responses from Bedrock, without any configuration to manage, for solutions that need to record a narrower set of properties or worry about ancillary resources to manage
- SageMaker inference requests are not covered by this feature. This only works with Bedrock foundation models (FMs).
- Administrators should know that model invocation logging can be done from the SDK, including enabling, updating existing, and deleting existing configurations
But there are real, tangible benefits in specific circumstances:
- On-demand inference can be logged, and a combination of logs with application inference profiles can serve as a decent foundation for an evaluation and monitoring solution
- While on-demand inference cannot be tagged, there is more transparency around calls and their binary outputs, along with the caller's identity and other important request data. Did the application generate an inappropriate image, wrong summarization, or a terrible quality video? All the runtime data and final output are available for analysis
Final Thoughts
Model invocation logging by itself yields a lot of information and data, which can increase costs for generative AI applications. When used in a overarching strategy that includes a solid understanding of data access patterns for this data, query sources, and desired outcomes from data analysis, it supplies vital runtime performance information that can be leading indicators of a model's performance over time, a crucial component in the overall evaluation of a generative AI application's performance.